One of the larger investigations into capnographic waveforms and peak flow meter measurement was in 2009.6 One hundred patients with acute asthma exacerbations were enrolled in the study. Prior to receiving any therapy, a peak flow measurement was taken and a capnogram was recorded (nasal cannula sampling capnometry). Once the attending physician felt comfortable that the patient was “fit for discharge,” another set of these parameters was ascertained. The investigators did not find a significant (P=0.35) change in the slope of Phase II of the capnogram between pre- and post-treatment. However, they were able to find a significant (P<0.001) decrease in the slope of Phase III and a significant (P<0.001) decrease in the α angle.6 Despite these noteworthy changes in the Phase III slope and α angle, there was poor correlation between these indices and the changes in peak flow pre- and post-treatment. Yaron et al made it a little bit easier by looking only at the slope of Phase III and its relation to bronchospasm in the ED.7 Similar to the previous study, they found a significant decrease in the slope of Phase III from 0.27 ± 0.05 to 0.19 ± 0.07 (P<0.005) between pre- and post-treatment with 2.5 mg of albuterol. Unlike the previously discussed study from Nik Hisamuddin et al, they were able to show a correlation (r=0.84) between the slope of Phase III to the log of the predicted peak flow.7 How does this hodgepodge of numbers actually pertain to clinical medicine? Let’s use a clinical case with capnograms and apply these ideas to help decide on the most appropriate disposition of the asthmatic patient.
Explore This Issue
ACEP Now: Vol 34 – No 09 – September 2015The Case
A 45-year-old female with an extensive history of asthma presents to the ED with the complaint of having an asthma exacerbation. Her respiratory rate is 24, and she is mildly hypoxic (91 percent) on room air and has moderate inspiratory and expiratory wheezing that is scattered among all lung fields along with subcostal accessory muscle use. Before the respiratory therapist gets an albuterol/ipratropium bromide treatment going, you attempt to get a peak flow. The patient blows into the peak flow only to get 125 L/min, but

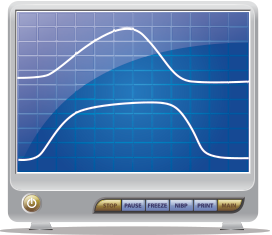
Figure 3. Top capnogram is before any intervention, and bottom is after treatment for the patient’s asthma.
you notice she isn’t using it correctly. You choose not to delay treatment any further and quickly obtain a baseline capnogram prior to the treatment. Figure 3 (top) shows her initial end-tidal capnogram. Subsequently, Figure 3 is after 10 mg of albuterol, 0.5 mg of ipratropium bromide, and 60 mg of prednisone. Despite the fact that her respiratory rate normalized, her wheezing nearly resolved, and her overall clinical status vastly improved, when you obtain a peak flow post-treatment, her best is only 150 L/min. Does she need to be admitted because of the peak flow measurements? You instead obtain a post-treatment capnogram and compare it to the pre-treatment result. Even with the naked eye, you can see the improvement in her end-tidal capnogram going from a shark fin appearance pre-treatment to a more normal waveform post-treatment. Taking into account the entire clinical picture and capnogram, the patient is discharged home.
The focus of using a capnogram as an assessment tool in asthmatics is not on the numeric end-tidal value but more so to evaluate the changes in the waveform morphology.
Using end-tidal capnography to monitor asthma exacerbations is not something new. You et al did one of the first investigations into capnography’s utility in asthma in 1992.8 Since then, many of the other studies have been making attempts to correlate these end-tidal indices with peak flow measurements. Peak flow measurements are largely dependent on the diameter of larger airways, whereas the capnogram is more dependent on the smaller airways; this may make it difficult to correlate the two values.6,7 With the improved accessibility of end-tidal monitors in nearly all EDs, why not hook your next asthmatic patient up to the monitor, take a look at the waveform, or even print it out prior to giving any treatments? Although more studies need to be performed and the results validated before this becomes the standard of care for asthmatics, the days of huffin’ and puffin’ into peak flows may be a thing of the past.
Pages: 1 2 3 | Single Page


No Responses to “How to Use End-tidal Capnography to Monitor Asthmatic Patients”