Emergency physician incomes in most areas of the United States continue to increase. In 2009–2010, the national average was $141 per hour. This year, the national average is $221 per hour, a 36 percent increase over 10 years. At the same time, the average full-time hourly requirement is decreasing from 1,632 to 1,560 clinical hours a year. I found several employers offering full-time equivalent hours as low as 1,240 a year. Of course, the fewer hours worked, the lower the annual compensation.
Explore This Issue
ACEP Now: Vol 38 – No 10 – October 2019Also tracking with huge gains are the number of employers open to hiring primary care board-certified (PC-BC) physicians for their emergency department openings. At 53 percent, it’s an increase of nearly 20 percent from last year. I believe the continuing supply-and-demand market in emergency medicine is driving these numbers. Employers in “geographically challenged” locations have no choice. As long as the 2,200 emergency medicine residency graduates continue to focus their job search on the same 15 locations, this issue will continue to grow. I also tracked the multistate large contract group penetration of the market. As of this year, 63 percent of jobs available in the specialty are with these large national contract groups (NCGs).
I want to thank all the groups, employers, and physicians who contributed to the research on this report. Getting real numbers is becoming more and more difficult, with fewer than 20 percent of job listings on all of the web job sites and classified ads providing any income information. Perhaps the competition in the job market has increased to a point where employers are afraid to be forthcoming. Recruiters, take note: From an impromptu survey I ran with physicians who were job searching this year, I discovered 83 percent are more likely to answer a job listing with compensation information than one without.
Trends for the 2019–2020 Recruiting Year
- The $300+ hourly rate is alive and well and growing nationwide.
- Overall availability of jobs this year is down 18 percent nationally.
- The highest concentrations of pediatric emergency physician jobs are in Florida and New Jersey.
- The highest rate of income is $395 per hour in New Mexico.
- The lowest rate is $130 per hour in New York City.
- Sign-on bonuses are topping out at $150,000, with the average closer to $40,000.
The following figures are based on first-year incomes for 1,560 clinical hours a year, down 72 hours from last year’s norm of 1,632. This change has impacted the annual package numbers, which are based on the 1,560 clinical hours, plus basic benefits valued at $30,000. The hourly averages include defined bonuses and RVU comp where applicable but do not reflect any sign-on bonuses or relocation or loan assistance. Rankings are based on state hourly averages, not the sporadic highs and lows.
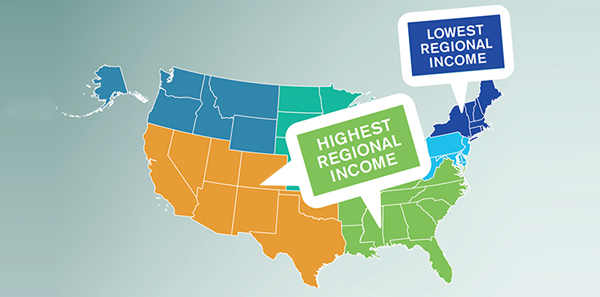
There is a tie for top regional income average, beginning with the usual leader, the Southeast, with an average salary of $234 per hour/$395,000 annually. NCGs are providing 80 percent of the jobs this season, and 56 percent of them are open to PC-BC physicians. The regional average is down 4 percent. There is a lot of activity in the Miami and Tampa areas.
Alabama: $272/hr., $454,000 ann.; 50% PC-BC; 60% NCG; high of $300/hr.; up 14%
Arkansas: $208/hr., $354,000 ann.; 87% PC-BC; 87% NCG; no significant highs; down 9%
Florida: $219/hr., $372,000 ann.; 12% PC-BC; 82% NCG; high of $350/hr.; down 5%
Georgia: $267/hr., $446,000 ann.; 71% PC-BC; 90% NCG; high of $365/hr.; up 11%
Louisiana: $234/hr., $395,000 ann.; 53% PC-BC; 50% NCG; no significant highs; up 9%
Mississippi: $266/hr., $446,000 ann.; 50% PC-BC; 50% NCG; high of $330/hr.; no change
North Carolina: $218/hr., $370,000 ann.; 59% PC-BC; 74% NCG; no significant highs; down 5%
South Carolina: $207/hr., $353,000 ann.; 50% PC-BC; 70% NCG; no significant highs; down 19%
Tennessee: $217/hr., $369,000 ann.; 71% PC-BC; 89% NCG; high of $330/hr.; no change
Also averaging $234 per hour/$395,000 annually is the West/Southwest region, with 62 percent of jobs open to PC-BC physicians and 72 percent of jobs being offered by NCGs. The regional average is up 6 percent, with a lot of activity in Houston and Phoenix. As usual, Utah remains tight as a vault, with no job openings or income information to be found.
Arizona: $256/hr., $430,000 ann.; 12% PC-BC; 64% NCG; high of $321/hr.; up 15%
California: $240/hr., $405,000 ann.; 73% PC-BC; 75% NCG; high of $300/hr.; up 10%
Colorado: $198/hr., $310,000 ann.; 67% PC-BC; 83% NCG; no significant high; up 17%
Hawaii: $205/hr., $349,000 ann.; 33% PC-BC; 66% NCG; no significant high; up 12%
Nevada: $224/hr., $379,000 ann.; 75% PC-BC; 83% NCG; no significant high; down 11%
New Mexico: $285/hr., $475,000 ann.; 100% PC-BC; 60% NCG; high of $395/hr.; no change
Oklahoma: $215/hr., $365,000 ann.; 50% PC-BC; 70% NCG; no significant high; no change
Texas: $251/hr., $422,000 ann.; 88% PC-BC; 76% NCG; high of $325/hr.; no change
Utah: No jobs open or information available
The Pacific Northwest averages are up 15 percent from last year at $231 per hour/$390,000 annually. Overall, 50 percent of the jobs open this year are available to PC-BC physicians, and 42 percent of them are with NCGs. There was no compensation information available for Alaska or Montana.
Alaska: No compensation information available; 33% PC-BC; 33% NCG
Idaho: $260/hr., $435,000 ann.; 100% PC-BC; 100% NCG; no significant high; up 14%
Montana: No compensation information available
Oregon: $215/hr., $365,000 ann.; 50% PC-BC; 50% NCG; high of $220/hr.; up 14%
Washington: $219/hr., $371,000 ann.; 35% PC-BC; 29% NCG; high of $250/hr.; up 21%
Wyoming: $230/hr., $404,000 ann.; 33% PC-BC; no NCG; high of $250/hr.; no change
The 13 states of the Midwest average $225 per hour/$381,000 annually, with 60 percent of the jobs open to PC-BC physicians and 54 percent of the jobs offered by NCGs. The regional average is up 10 percent. North Dakota was unavailable, but look for some high activity in Chicago.
Illinois: $226/hr., $382,000 ann.; 36% PC-BC; 58% NCG; high of $269/hr.; down 3%
Indiana: $213/hr., $362,000 ann.; 42% PC-BC; 75% NCG; high of $245/hr.; down 7%
Iowa: $238/hr., $400,000 ann.; 43% PC-BC; 45% NCG; high of $273/hr.; up 20%
Kansas: $225/hr., $381,000 ann.; 62% PC-BC; 77% NCG; high of $265/hr.; up 16%
Kentucky: $227/hr., $384,000 ann.; 79% PC-BC; 92% NCG; high of $365/hr.; no change
Michigan: $206/hr., $351,000 ann.; 70% PC-BC; 75% NCG; high of $225/hr.; up 5%
Minnesota: $205/hr., $350,000 ann.; 66% PC-BC; 33% NCG; no significant high; no change
Missouri: $234/hr., $396,000 ann.; 63% PC-BC; 38% NCG; high of $315/hr.; up 12%
Nebraska: $223/hr., $378,000 ann.; 66% PC-BC; 33% NCG; no significant high; up 15%
North Dakota: No jobs open or information available
Ohio: $241/hr., $406,000 ann.; 56% PC-BC; 82% NCG; high of $260/hr.; up 9%
South Dakota: $154/hr., $270,000 ann.; 100% PC-BC; no NCG; $100,000 sign-on; no comparison available
Wisconsin: $239/hr., $402,000 ann.; 41% PC-BC; 45% NCG; high of $300/hr.; up 10%
The Mid-Atlantic states are up 10 percent, with a regional average of $212 per hour/$360,000 annually. The District of Columbia is silent this season, but both Philadelphia and Baltimore are active. Overall, 31 percent of jobs are open to PC-BC physicians, and 65 percent of the jobs are with NCGs.
Delaware: $166/hr., $290,000; no PC-BC; 50% NCG; no significant high; no change
District of Columbia: No jobs open or information available
Maryland: $213/hr., $362,000 ann.; 9% PC-BC; 50% NCG; high of $266/hr.; up 14%
New Jersey: $208/hr., $356,000 ann.; 19% PC-BC; 86% NCG; high of $270/hr.; no change
Pennsylvania: $223/hr., $378,000 ann.; 27% PC-BC; 52% NCG; high of $300/hr.; no change
Virginia: $232/hr., $392,000 ann.; 30% PC-BC; 69% NCG; no significant high; down 10%
West Virginia: $230/hr., $388,000 ann.; 100% PC-BC; 85% NCG; high of $236/hr.; up 16%
Only 21 percent of jobs in the Northeast are open to PC-BC physicians, and the NCG penetration is only 32 percent. Regional averages are up 5 percent at $192 per hour/$330,000 annually. Both Boston and New York City show activity.
Connecticut: $198/hr., $337,000 ann.; 16% PC-BC; 28% NCG; high of $216/hr.; up 10%
Maine: $190/hr., $326,000 ann.; 25% PC-BC; 20% NCG; no significant high; up 9%
Massachusetts: $210/hr., $357,000 ann.; 5% PC-BC; no NCG; high of $250/hr.; up 12%
New Hampshire: $186/hr., $320,000 ann.; 21% PC-BC; 43% NCG; no significant high; no change
New York: $216/hr., $367,000 ann.; 29% PC-BC; 60% NCG; high of $275/hr.; up 4%
Rhode Island: $165/hr., $287,000 ann.; 50% PC-BC; 75% NCG; no significant high; no change
Vermont: $180/hr., $310,000 ann.; no PC-BC; no NCG; no significant high; no change

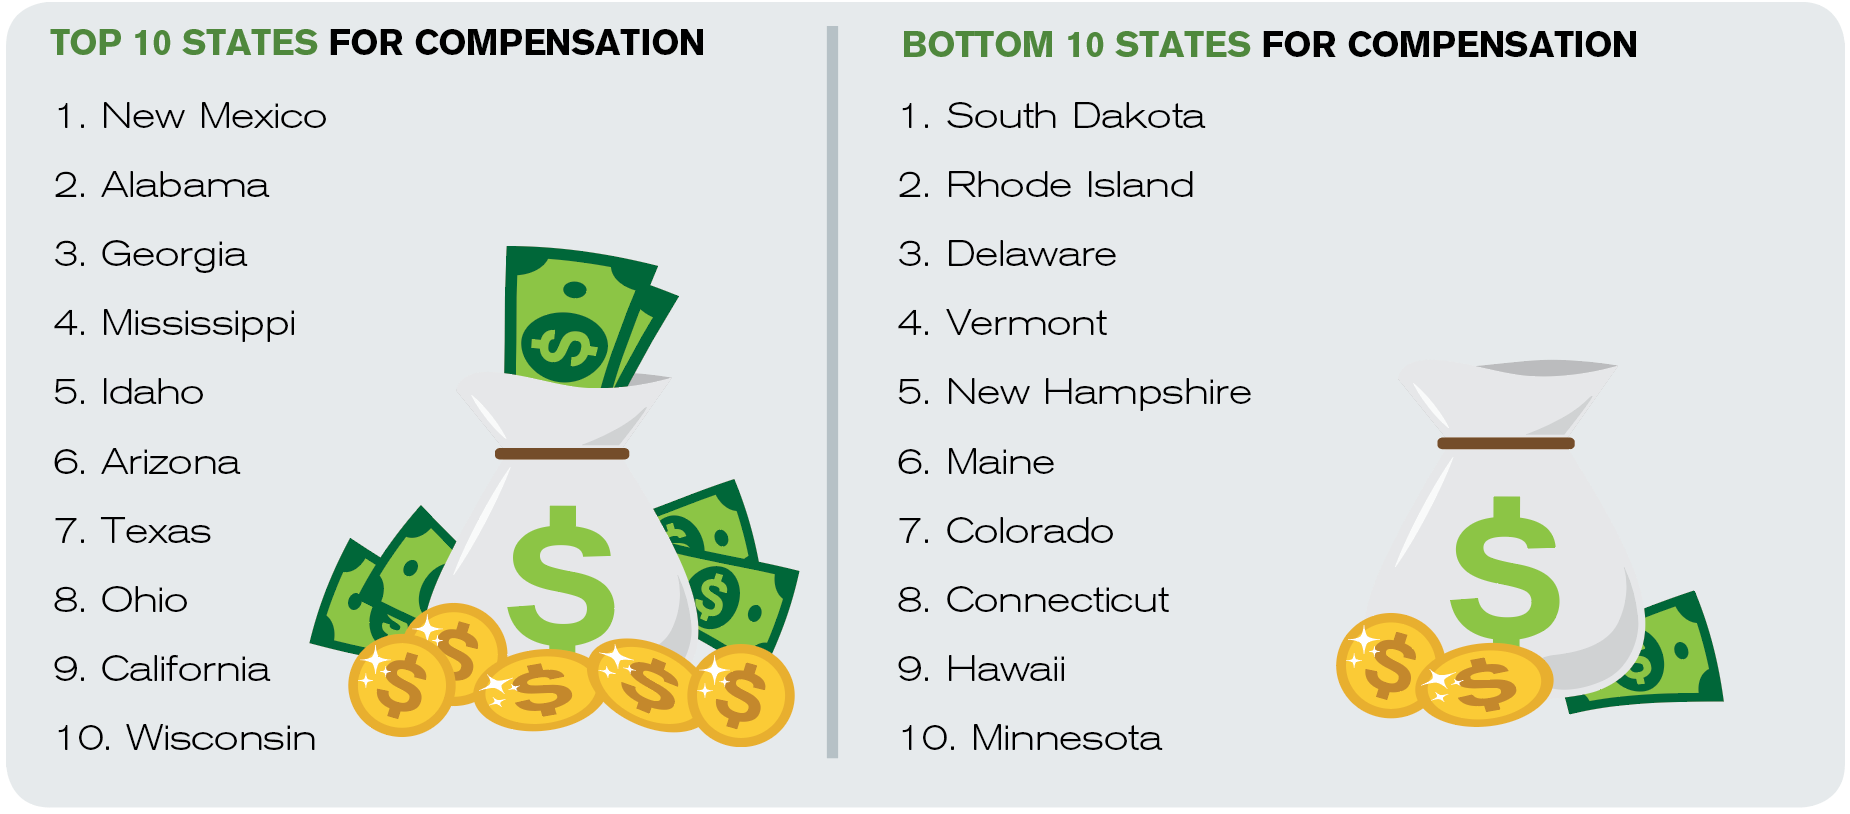
Figure 1. States Offering the Most and Least Compensation
Ms. Katz is president of The Katz Company EMC, a member of ACEP’s Workforce and Career sections, and a frequent speaker and faculty at conferences and residency programs. Contact her at katzco@cox.net.
Pages: 1 2 | Multi-Page


2 Responses to “2019–2020 Emergency Physician Compensation Report”
December 3, 2020
ChangWhen will ACEP 2020-2021 compensation report be published?
January 14, 2021
Dawn Antoline-WangDue to the unstable market conditions in 2020 and the limited availability of compensation data, we will not be publishing a 2020-2021 compensation report. We are exploring other approaches to covering the EM job market in 2021 and hope to be able to resume the compensation report with the 2021-2022 period.