New waves and challenges of COVID-19 keep coming. Emergency physicians keep managing the front lines, caring for patients with increasing severity of illness and stacked in hallway beds in the emergency department.
Explore This Issue
ACEP Now: Vol 41 – No 02 – February 2022The performance of emergency departments in 2020 has been summarized by the Emergency Department Benchmarking Alliance (EDBA) in its annual survey report. One of the operational changes that occurred in the pandemic year was a significant increase in patient transfers from emergency departments. This trend is no doubt accelerating in 2022.
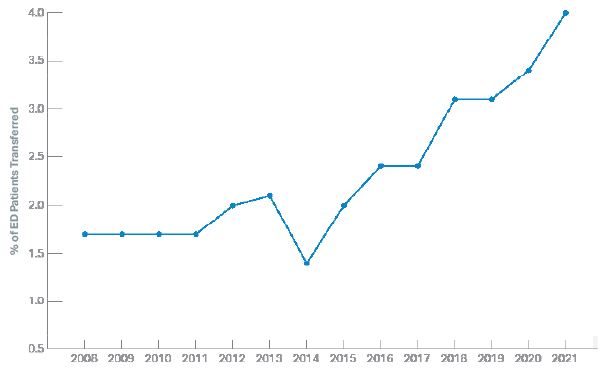
The average transfer rate in 2019 for all emergency departments was about 3.1 percent. The data for 2020 showed a transfer rate of 3.4 percent, with the ongoing transfer rate higher in small-volume emergency departments at 5.6 percent. Transfer rates were up across all types of departments. More important, the transfer rate of 3.4 percent was twice that of the survey done in 2011. Table 1 displays the trends in ED transfer rates over the last 13 years.
How Many Patient Encounters Does That Reflect?
The ED volume in the United States in 2019 was around 160 million patients. At the 3.1 percent transfer rate, that was almost 5 million patients being transferred in a year, or almost 14,000 patients a day. That is a lot of patient movement, with each transfer requiring significant coordination work and compliance programs related to the Emergency Medical Treatment and Labor Act (EMTALA) requirements. These data do not include freestanding emergency departments, which have patients who can place additional burdens on the transfer resources of hospitals and hospital systems.
This only represents ED transfers; some hospitals also must transfer patients out of inpatient units when patient needs are identified that cannot be managed in the first hospital.

Table 1. Trends in Transfers of ED Patients
Which Patients Are Being Transferred?
The annual study of ED visits by the Centers for Disease Control and Prevention (CDC) in its National Hospital Ambulatory Care Survey characterizes ED visits by disposition. One of the disposition types is patients being transferred to psychiatric hospitals. From 2011 to 2019, the CDC reports that about one-third of patient transfers were to psychiatric facilities for mental health treatments. That is true for the last set of data tables published for ED visits in 2018.1 Mental health transfers represent one of the greatest areas of specialized care, which hospitals appear unprepared to handle. And this was prior to COVID, which makes these types of transfers even more difficult.
What Factors May Be Contributing to ED Transfers?
ED transfer rates vary dramatically by cohorts, as seen in Table 2. Transfer rates in small-volume emergency departments are at least five times higher than those of high-volume ones.
The results of the survey indicate that fewer hospitals in rural communities have the resources to keep complex patients. This included COVID patients in 2020. Rural hospitals have been closing service lines and been unsuccessful in recruiting physicians willing to care for complex patients. Rural facilities also have limited financial resources to care for high-cost patients.
Table 2: ED Patients Transferred, by Cohort of EDs, in 2020
| Emergency Department Cohort | % of ED Patients Transferred |
|---|---|
| All EDs | 3.4 |
| Adult EDs | 1.6 |
| Pediatric EDs | 2.5 |
| Over 80K volume | 0.9 |
| 60–80K | 1.6 |
| 40–60K | 2.1 |
| 20–40K | 2.9 |
| Under 20K volume | 5.6 |
Pages: 1 2 3 | Single Page


No Responses to “Another COVID Casualty: the Emergency Department Transfer Process”