Explore This Issue
ACEP Now: Vol 35 – No 01 – January 2016Image Credit: ILLUSTRATION/PAUL JUESTRICH; PHOTOs shutterstock.com
There is considerable variation in the staff that provide patient care in American EDs. The Emergency Department Benchmarking Alliance (EDBA) has hosted three summits to develop the most effective definitions of staffing and markers of care. The definitions are completed and published and are being used in the annual EDBA survey.1 The definitions developed by the EDBA consider four classes of ED staff: physicians, advanced practice providers (APPs), nurses (not differentiating the various levels of staff nurses), and the group composed of personnel who function in technical and clerical roles. For the computation of clinical performance, the EDBA collects data on daily staffing of these groups only counting those who are in a patient-care function.
For the last five years, the data have tallied the scheduled number of work hours in an average day for nurses, techs, clerks, physicians, and APPs. Counting the hours allows a calculation of productivity for each of these groups. All have been calculated using the same mathematical formula: number of ED patients visiting the ED on an average day divided by the number of scheduled hours for persons in a clinical role in an average day. It’s a common calculation for physician productivity.
Many emergency physicians have documented the loss of productivity and difficulties in patient flow when information systems do not support the role of physicians and APPs.
At the initiation of the EDBA studies 21 years ago, it was necessary to develop a formula that allowed comparison of staffing ratios where APPs were working in collaboration with emergency physicians (most patients seen with a physician rather than without). At that time, the shared role of ED patient management by physicians and APPs did not allow the same level of productivity of APPs as physicians. So in calculating the overall productivity of the licensed independent practitioners (physicians plus APPs) in an ED, the APP hours were assigned a factor of 0.5 the number of physician hours.
Example: An ED sees an average of 100 patients a day and uses 40 scheduled physician hours and 20 scheduled APP hours.
The calculation of physician productivity is 100 patients divided by 40 hours, or 2.5 patients per physician hour.
The calculation of licensed independent practitioner productivity is 100 patients divided by (40 physician hours + 20 APP hours multiplied by a factor of 0.5), or 100 divided by (40 + 10), equaling 2.0 patients per hour.
Through the last 20 years, APPs have assumed more independence in patient management in the ED, and in some EDs, it is now possible to measure patient care separately for the two types of practitioners. However, to maintain consistency, the EDBA productivity formula has not changed.
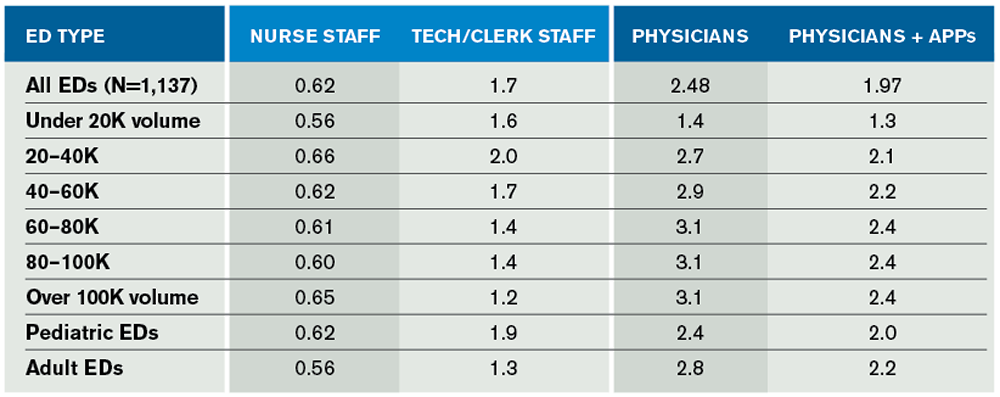
The results of the 2014 EDBA data survey are presented in Table 1.

(click for larger image) Table 1. Patients Seen Per Hour in the EDBA Data Survey for Calendar Year 2014
Staffing Ratios
Nurse staffing ratios indicate there are about 0.62 patients managed per nurse-staffed hour per day. That ratio has been very consistent over five years and also across the different volume and types of EDs. Table 2 presents the staffing ratios of all groups of ED staff since 2010.

(click for larger image) Table 2. Patient-Per-Hour Staffing Ratios Over the Last 5 Years of EDBA Surveys
The second columns of Table 1 and Table 2 reflect the use of support staff in the ED. Combining tech and clerk hours, the service ratio averaged about 1.7 patients per scheduled hour. There has been an increase in this ratio over the last five years. This may reflect the decreased number of hours staffed by clerks as the use of physician computerized order entry and other technologies has expanded.
Emergency physician staffing produced an average of 2.48 patients seen per hour. When attending physician coverage was supplemented by APPs and the APP hours were given a factor of 0.5 (as above), the staffing ratio averaged 1.97 patients per hour.
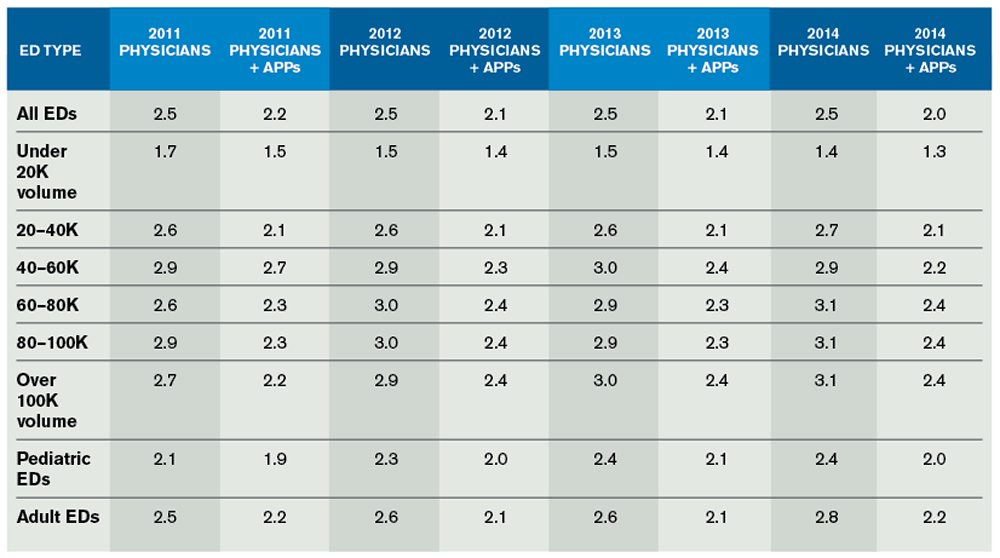
Table 3 focuses on the productivity of physicians and APPs in all the cohorts of EDs over the last four years. There has been an increasing number of EDs utilizing APP staffing. Those that use APPs appear to be increasing the number of hours relative to physician staffing. This staffing change may facilitate the continued increase in ED volume across all cohorts. But APP staffing has the greatest impact on the relative productivity of emergency physicians in EDs with over 20,000 volume per year.

(click for larger image) Table 3. Licensed Independent Practitioner Patient-Per-Hour Staffing Changes Through the Years
From the data, it appears that emergency physician productivity is slowly increasing. This could be attributed to increasing ED presence of APPs, who assist in overall patient flow. But many EDs appear to be better able to accommodate the loss of physician productivity from the implementation of electronic tools in the ED. Many emergency physicians have documented the loss of productivity and difficulties in patient flow when information systems do not support the role of physicians and APPs. There are perhaps now some signs that providers have adapted to the use of those systems.
The use of APPs allows a reduction in time to provider and allows the staff to implement programs that reduce patient walkaway rates.
It is critical that emergency physicians and APPs be able to see patients, place orders in their electronic medical record, and provide documentation of patient care. The technologies must be simplified to improve the work capabilities of all providers and, in particular, must facilitate the work of physicians, who serve at the highest level of decision making. Emergency physicians must fill the important role of overseeing patient care and the work of APPs for certain patients.
The EDBA data have followed the trend toward increasing use of APPs in the ED. This has been correlated with improved intake processing of patients and reduced walkaway rates.
 James J. Augustine, MD, FACEP, is director of clinical operations at EMP in Canton, Ohio; clinical associate professor of Emergency Medicine at Wright State University in Dayton, Ohio; vice president of the Emergency Department Benchmarking Alliance; and on the ACEP Board of Directors.
References
- Wiler JL, Welch S, Pines J, et al. Emergency department performance measures update. Acad Emerg Med. 2015;22(5):542-553.
Pages: 1 2 3 | Multi-Page


3 Responses to “Emergency Department Benchmarking Alliance Releases 2014 Data on Staffing, Physician Productivity”
February 14, 2016
Eric S. WeinsteinIs this what the market bears? Is this the tail wagging the dog?
January 7, 2019
Coach LeeI think its the egg laying the chicken
December 6, 2016
jon elleFantastic article . I was fascinated by the details – Does someone know if my company could grab a template AZ Practitioner Data Form example to edit ?