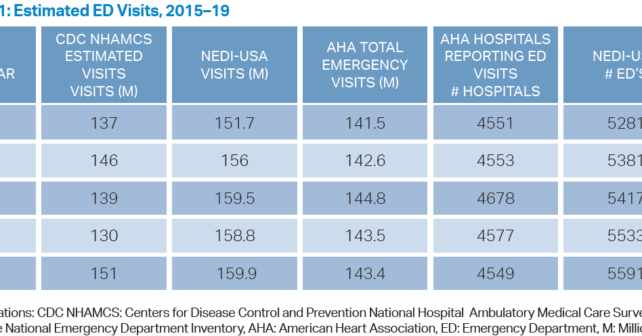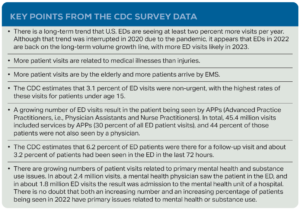
Payer mix in 2019 trended in line with numbers from prior years. This is the fifth year that Medicaid and CHIP accounted for the largest expected source of payment—40.9 percent of ED visits. Next was private insurance (at 29.4 percent of ED visits), Medicare (19.8 percent), and no insurance (8.3 percent). Table 2 reflects the trend in the payer mix over the last five years of CDC data collection. For most EDs, Medicare and Medicaid will make up at least 50 percent of the payer mix. The most frequent payer type for patients admitted to the hospital through the ED was Medicare (44 percent) followed by private insurance (31 percent), Medicaid/CHIP or other state-based program (26 percent), and no insurance (five percent).
 Dr. Augustine is national director of prehospital strategy for US Acute Care Solutions in Canton, Ohio, clinical professor of emergency medicine at Wright State University in Dayton, Ohio, and vice president of the Emergency Department Benchmarking Alliance.
References
- Cairns C, Kang K, Santo L. National hospital ambulatory medical care survey: 2019 emergency department summary tables. Centers for Disease Control and Prevention website. www.cdc.gov/nchs/data/nhamcs/web_tables/2019-nhamcs-ed-web-tables-508.pdf. Updated July 29, 2022. Accessed October 9, 2022.
- Augustine, James J. ED usage trends before COVID-19. ACEP Now. 2020;39(5):21.
Pages: 1 2 | Single Page


No Responses to “Emergency Department Patient Challenges to Come”