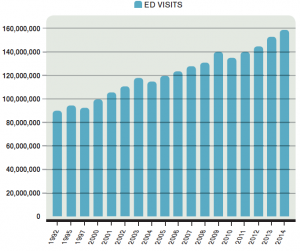
Do you have a sense for the national utilization trends for ED services? Do you know who we are caring for in our emergency departments and what the community expects from us? Do you know how your ED compares in terms of census and acuity and who exactly can be expected to show up at your door? You should! Here is a great cocktail-party factoid: the equivalent of the entire U.S. population will visit the ED every three years. You may not go to the ED, but your grandmother goes twice. The emergency department is part of the fabric of everyday life and occupies a central place in most communities.
Explore This Issue
ACEP Now: Vol 33 – No 11 – November 2014In this column, I will review the trend data from the National Hospital Ambulatory Medical Care Survey (NHAMCS) to paint a vivid picture about who comes to us in the ED. From these data trends, we can anticipate what this means for the operational management of your ED. The latest date for which we have national ED visit trend data is 2009. The NHAMCS report gives us a context for looking at the trends we are seeing locally. The 2009 report is based on data from a sample of 34,942 ED visits from 356 emergency departments. From this data and using national population census numbers, an estimate of utilization of ED services by populations was developed, and such data should be used to plan whom you will care for and what their anticipated needs will be. A few highlights of this report include:
- ED visits continue to rise and will reach more than 140 million this year (2014). ED visits have increased an average of 2.8 percent each year for the last 20 years.
- The population studies indicate the utilization rate of the ED jumped from 414 visits per 1,000 population in 2008 to 451 visits per 1,000 in 2009. Our communities are using us more, often as the only available option for unscheduled care.
- Eighteen percent will arrive by ambulance (this is increasing), and 82 percent will walk in.
Who are the highest utilizers of ED services in your community? You may be surprised. It is probably not unexpected that homeless persons are the high utilizers in terms of ED visits, but infants are as well. In total, with the modified census data, the top prevalence uses of the ED are:
- Homeless persons, at 1,005 visits per 1,000 population (the homeless come more than once per person per year).
- Infants under age one, at 979 visits per 1,000 population, suggesting that we are indeed the place where young families turn when they have concerns about an infant’s health and wellness.
- African Americans age 75 and older, at 947 visits per 1,000 population. Elderly minorities are high utilizers.
- African Americans ages 15–44, at 902 visits per 1,000 population, likely reflecting access issues.
- Nursing home residents, at 851 visits per 1,000 population, suggesting that efforts to reduce the number of unnecessary transports from nursing homes to the ED, for example, with well-run telemedicine services, would likely be high leverage strategies for responding to high utilization.
It should come as no surprise that there are racial and ethnic disparities in ED visit rates, reflecting overall differences in health care delivery and access. The visit rate for Caucasians is 413 visits per 1,000 population. The visit rate for African Americans is 851 visits per 1,000 population. The visit rate for other races is 242 visits per 1,000 population. The utilization for all groups continues to rise.
The admission rate for ED patients has risen insidiously over the past two decades to 17 percent, with many larger urban and tertiary care hospital emergency departments reporting rates of twice that.
A change in the categories of patients presenting to EDs has been noted over the past 30 years. In particular, accidents and injuries are decreasing as a percentage of the ED visits. In 1980, just more than half of ED patients had illness, 40 percent had injuries, and a small percent had behavioral problems. Fast-forward to 2010 and a full 70 percent had illness, only 23 percent had injury, and behavioral complaints accounted for close to 10 percent of ED visits nationwide. The decrease in injuries is a success story about the culmination of many safety initiatives, including seatbelt usage, drunk-driving initiatives, and occupational safety initiatives. Sadly and concurrent with this decrease in accidents and injuries, mental health resources have been unfunded, and the behavioral health needs of the community have increased. The behavioral health category of patients encompasses acute psychiatric crises, substance abuse, detoxification needs, and acute drug and alcohol intoxication. These needs are being met with difficulty because strategies and solutions must come from communities and have been harder to develop.
In addition, the percentage of geriatric patients arriving with complex medical problems has been increasing. This has resulted in more complicated diagnostic and management strategies for patients with many comorbid conditions. The admission rate for ED patients has risen insidiously over the past two decades to 17 percent, with many larger urban and tertiary care hospital emergency departments reporting rates of twice that. Further, the acuity is rising when tracked by CPT codes (by the Emergency Department Benchmarking Alliance Annual Survey). These patients do not lend themselves to a quick in-and-out model for an ED visit and may require changes in the way we orchestrate the ED visit. In addition, the expectations of the public will need to be managed as the services being provided are changing.
Here are a few questions to ask your colleagues at your next department meeting as you look at the data relevant to the patient population you are serving:
- Do you see enough elderly patients? Perhaps it is time to think of developing a geriatric ED service line to meet their needs? Could this be done in a clinical decision unit to allow for enough time to fully evaluate complex patients? Do you have enough case management support for these patients? Is your department friendly for seniors in terms of its design and amenities? Do you have care process models in place for common or acute geriatric diagnoses like stroke, hip fracture, and medication-related issues? Do you need to look at nursing home transfers?
- Have your processes, staff, and patient flow kept pace with the behavioral health needs of your community? Do you need a small behavioral health unit? Do you have ample support staff in the form of crisis workers and social workers with psychiatry backup? Do you have policies and protocols in place for managing potentially violent or suicidal patients?
- Do you have appropriate service lines for your pediatric population? This may include things like a bronchiolitis clinic during the winter months and croup protocols. Would it make sense to flow most pediatric patients through your fast track (low-acuity zone) in lieu of the loss of other accident and injury patients?
- Have you recognized the ethnic and cultural needs of your community? For instance, do you have information for common ED conditions in the languages represented by your community? Should you recruit for ethnic and minority representation in your ED team?
The bottom line is this: you need to know who is coming and you need to prepare for every subset of patients. By studying national trends and capturing this data locally, we can optimally prepare for the needs of the communities that we serve.
 Dr. Welch is a practicing emergency physician with Utah Emergency Physicians and a research fellow at the Intermountain Institute for Health Care Delivery Research. She has written numerous articles and three books on ED quality, safety, and efficiency. She is a consultant with Quality Matters Consulting, and her expertise is in ED operations.
Pages: 1 2 3 | Multi-Page


No Responses to “Emergency Department Usage Trend Data Can Help Physicians Prepare for Patients”