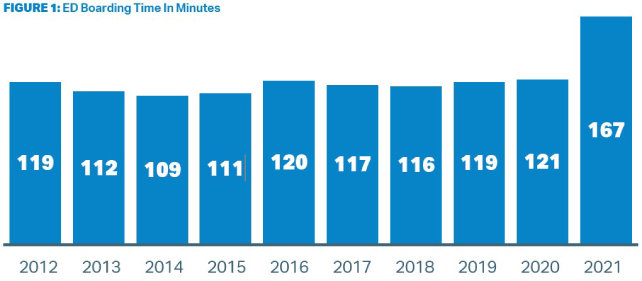
ED leaders must work with hospital leaders to shorten boarding time. In CMS’s language, boarding time is the median time (in minutes) from admit decision time to time of departure from the ED for patients admitted to inpatient status. Figure 1 shows that truly little progress had been made in reducing boarding time in the nine years ending in 2020. Then, in 2021, boarding times increased markedly by 39 percent (46 minutes).
Boarding time directly correlates with LBTC rates and ED length of stay. EDBA uses the “Left Before Treatment Complete (LBTC)” as the single statistic that counts all patients who present to the ED for care and leave before they are supposed to. This provides the most complete accounting for all patients who leave the ED, and includes those patients who leave before or after the medical screening exam, those that leave against medical advice (AMA), and those that elope.
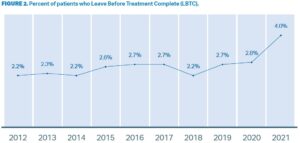
The percentage of patients who left the ED prior to the completion of treatment increased to 4.0 percent, from 2.8 percent in 2020 (Figure 2).
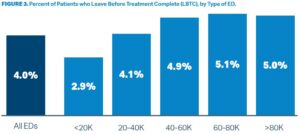
LBTC tracks closely and worsens with increasing ED volume (Figure 3). Every cohort had record-high LBTC rates in 2021, higher than in any year since the EDBA began collecting data in 2004. Even Freestanding EDs saw a jump in LBTC rates. In 2019, FSEDs had a LBTC rate of 1.6 percent. In 2021, that rate increased to 2.3 percent.
How dramatic was the increase in patients who walked away from the ED?
The overall LBTC rate of four percent in 2021 also represents far more patients than any prior year. In 2020, 3.8 million patients walked away from the ED before their evaluation was complete. In 2021, that amounted to about 6 million patients. 2.2 million more ED patients left before their ED treatment was complete than in 2020.
Working Forward: Restoring Flow Through the ED and Reducing LBTC Volumes
At the present time, ED and hospital leaders should anticipate that ED volumes have returned to the trend of stable increases.
Emergency department operations in 2021 were significantly impacted by many factors which reduced flow, increased walkaway rates, and greatly stressed ED staff. These operational challenges are now layered onto the 2022 volume of patients that are about the same, if not higher, than 2019. Increasing patient acuity also further strains ED operations.
Pages: 1 2 3 | Single Page


No Responses to “First Look: Emergency Department Operations in the Pandemic Year 2021”