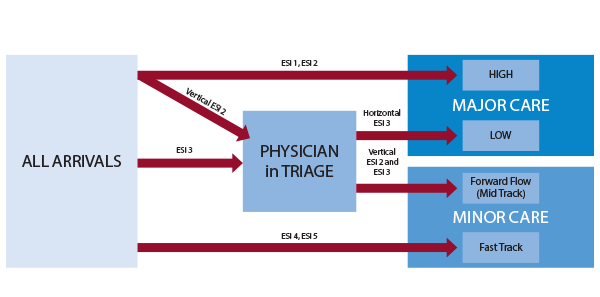
The HUP emergency department is a data-rich department, and it was able to manage each zone by studying zone-specific data. For each geographical zone, the leadership assessed:
- Appropriate streaming (mean ESI and admission rate)
- Productivity (daily volume and percent of volume)
- Efficiency (door-to-doctor time and length of stay)
The ED operations leadership team monitored each area and developed inclusion and exclusion criteria, time and volume targets, swim lanes delineating the roles of each person in the zone, and job description sheets for each role in each zone. This operational cleanup and standardization made it easier for everyone to know what was expected within each role.
The icing on the cake for the HUP ED 2.0 Project was the development of high-flow strategies. Department leaders identified early signs (triggers) that an area was becoming overwhelmed. Designated shift leaders (such as patient-flow coordinators, charge nurses, etc.) were trained to identify problems in a zone in real time, and for each high-flow situation, there was a short-term remedy. For instance, if the physician in triage was overwhelmed, creating a bottleneck, the Forward Flow (mid-track) attending physician would float to the triage area to help that physician get caught up. If a lab technician was behind, there might be backup.
The overarching theme in high-flow strategies is to have standardized and articulated trigger-response strategies mapped out in advance but activated in real time, deploying necessary personnel to an area to help the overwhelmed role in an overwhelmed zone.
High-flow strategies depend on physical layout, staffing models, and culture. As a result, they can be idiosyncratic to a particular emergency department. Many emergency departments attempt to manage high-flow situations with on-call arrangements, but that strategy is often not nimble enough. By the time an on-call physician or nurse is on scene, the crisis often has passed. The real-time strategies employed at HUP have been tried elsewhere but are not embedded into most emergency department operations.
Table 1: Metrics Before and After HUP ED 2.0 Implementation
| Metric | Baseline 2019 | First two months after go live |
|---|---|---|
| Daily volume | 168 | 183 |
| Boarding minutes | 342 | 457 |
| Admission rate | 29.9% | 30.8% |
| Door-to-doctor time | 81 | 25 |
| Length of stay (LOS) overall | 368 | 310 |
| LOS admitted | 690 | 741 |
| LOS discharged | 300 | 231 |
| LOS fast track | 169 | 118 |
| LOS mid track | NA | 240 |
| Walkaway total % | 8.9% | 3.6% |
The Results
The sum total of this sophisticated approach to ED operational challenges appears in Table 1. Door-to-doctor time fell by 70 percent, walkaways declined by 60 percent, and length-of-stay/discharged time dropped by more than an hour. These remarkable results were achieved despite several adverse headwinds, which included an overnight 9 percent volume increase (related to the closure of a nearby safety-net hospital), a 34 percent increase in boarding minutes (time from decision to admit to departure time), and an attending physician shortage (resulting from a 5 percent reduction in physician staffing).
HUP’s ED operations team continues to optimize the new flow model. But HUP ED 2.0 demonstrates the power of a multidisciplinary effort that combines creative problem-solving with data-driven decision making.
Pages: 1 2 3 | Single Page


No Responses to “Pennsylvania ED Re-Engineers Patient Flow to Reduce Boarding Burden”