Do you know the national utilization trends for emergency department services? Do you know what you will be doing to, for, and with your patients? How about what you will need to provide for patients so that you can have those services staffed and available?
Explore This Issue
ACEP Now: Vol 34 – No 02 – February 2015In my last column (November 2014), we looked at national trends in the National Hospital Ambulatory Medical Care Survey (NHAMCS) and translated them into a picture of who will come to us in our emergency departments. In this column, I will review recent trend data from the Emergency Department Benchmarking Alliance (EDBA) annual data survey to paint a second vivid picture about the work that we do. From these data trends, we can anticipate the needs of the operational management of your ED.
The median ED volume is now approximately 40,000 visits per year (according to the 2012 data set), and the daily dashboard for an emergency department
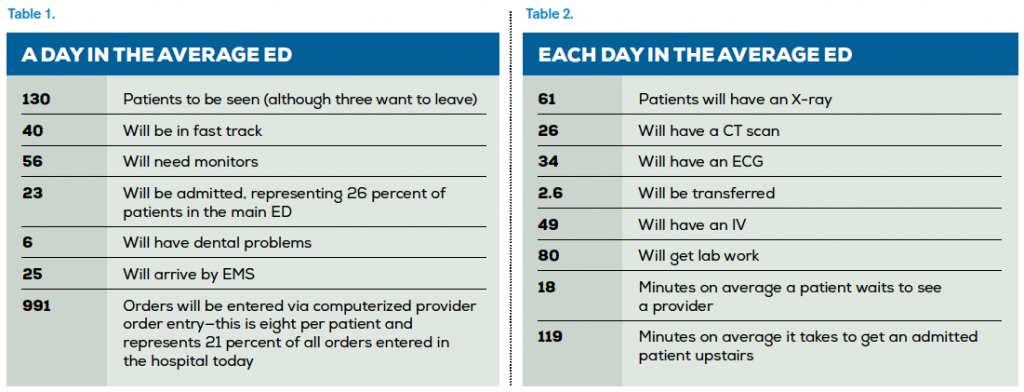
James J. Augustine, MD, FACEP, vice president of the nonprofit EDBA, believes everyone working in an emergency department should know that department’s dashboard data. The median ED volume is now approximately 40,000 visits per year (according to the 2012 data set), and the daily dashboard for an emergency department is shown in Table 1.
Knowing this data, are you getting upstream of admissions? Are your transporters anticipating 23 trips upstairs with gurneys? Is your fast track optimized in terms of staffing and supplies? Do you open your fast track early enough during the day? Do you have dental supplies and a referral list for low-cost dental providers? Do you alert admitting when an ambulance arrives (because 42 percent of ambulance patients are admitted)?
Next, let’s look at what we will typically do to patients, for them, and with them in Table 2.
Again, are you prepared? Do you have enough imaging staff, particularly on the evening shift? Do you have rapid capability for doing ECGs? Do you have foolproof processes for lab collection, labeling, transportation, and results? Do you have enough IV fluid bags on hand for the day? Are you trying to improve on those critical time intervals (door-to-provider and admit-decision-to-departure times)?
Here are few more interesting facts from the Centers for Disease Control and Prevention and NHAMCS.
The chronic diseases seen most often in the ED are:
- Diabetes (8.6 percent)
- Congestive heart failure (3.1 percent)
- Stroke or cerebrovascular disease (3 percent)
- The most commonly admitted disease entities in the ED are:
- Schemic heart disease
- Chest pain
- Pneumonia
- Psychoses
- Cerebrovascular disease
It is no mystery—the data inform us. Knowing who is coming to the ED, what they will need, and what a typical day will look like in your department, you can be better prepared for what is coming to an ED near you.
 Dr. Welch is a practicing emergency physician with Utah Emergency Physicians and a research fellow at the Intermountain Institute for Health Care Delivery Research. She has written numerous articles and three books on ED quality, safety, and efficiency. She is a consultant with Quality Matters Consulting, and her expertise is in ED operations.
Pages: 1 2 | Multi-Page


No Responses to “Emergency Department Benchmarking Trend Data Help Physicians Anticipate Operational Management Needs”