Emergency department flow and reduction of patient walkaway are both very important performance measures. Flow requires coordinated utilization of staff, equipment, processes, and documentation. The Emergency Department Benchmarking Alliance (EDBA) has hosted three summits to develop the most effective definitions of time intervals and markers of care. The definitions are completed and published and are being used in the annual EDBA survey.1 The latest survey compiled 2013 data from 1,152 EDs that saw 45 million patients.
Explore This Issue
ACEP Now: Vol 34 – No 07 – July 2015The issues of timeliness of care, flow through the emergency department, and waiting room issues have clearly activated the regulators in the industry, the Joint Commission, and the public media. Patient flow includes the various intervals that reflect the time spent by a patient in the ED. A time interval is best expressed as an arithmetic median (the middle number of a set when the values are arranged in order from lowest to highest) as opposed to a mean (the average of a set of values).
ED leaders have most control over the flow of patients who are evaluated, treated, and released from the department. This represents about 80 percent of the patients seen in American emergency departments. ED staff can identify that the flow of patients who are ultimately admitted to the hospital, or transferred for admission to another hospital, is influenced by many factors outside their control. However, patients managed completely in the ED represent the overwhelming majority of the flow and also represent the persons more likely to express their displeasure with prolonged delays in care by walking out the door. For those who stay, longer delays (without explanation) are likely to result in lower scores on their experience of care.
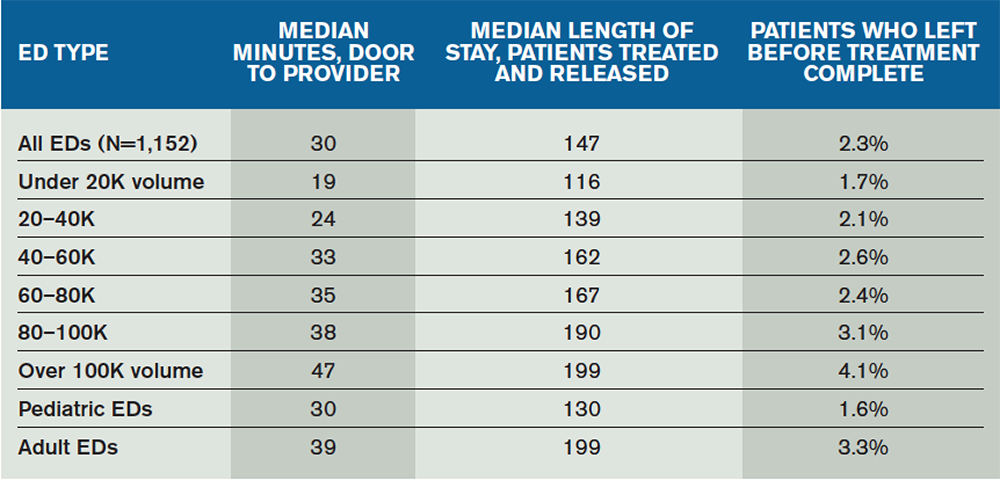
There is correlation between median length of stay and walkaway rates of patients from the ED (see Table 1). Within the cohorts of EDs, the patient population responds to flow improvements by reducing the tendency to walk away. Patient walkaway rates are particularly impacted by shorter “time to provider,” where the provider is either a physician or an advanced practice provider (APP).
The median time from door to provider for all EDs has decreased to about 30 minutes. The 10-year trend reflects that most EDs are improving the intake time, with clear stratification by ED volume. The EDs over 40,000 volume have a median time of about 37 minutes; that decreases to about 23 minutes for patients seen in EDs under 40,000 volume.
Improvements in the intake flow lead to improvements in overall patient flow through the ED, most notably for patients who are treated and released. The median length of stay for treat-and-release patients has decreased to 147 minutes and less than that for EDs that serve primarily pediatric populations. The EDs over 40,000 volume treat and release patients in a median of 169 minutes; that decreases to 130 minutes for patients seen in EDs under 40,000 volume.
Improvements in the intake flow lead to improvements in overall patient flow through the ED, most notably for patients who are treated and released.
It is critical to reduce the number of persons who enter the ED but leave prematurely at any point. The EDBA and other oversight bodies, realizing that definitions can be very important to consistency in reporting, have developed an inclusive term: “left before treatment complete.” This single statistic provides the most complete accounting for all patients who leave the ED before they are supposed to, and it includes those patients who leave before or after the medical screening exam, those who leave against medical advice, and those who elope.
The flow improvements found using early contact with a provider have resulted in many EDs with volumes over 30,000 placing a provider in the intake process. There are at least 91 EDs that have physicians in the greeting process and at least 88 that use APPs in that role. That means these new forms of “team greeting” systems are present in more than 28 percent of EDs over 30,000 volume.
There is considerable discussion about the role of information systems, which have received billions in funding from the federal government, related to productivity and effectiveness of physicians who serve in hospitals. Many ED leaders have noted a loss of productivity and decrease in patient flow when information systems do not support the clinical role of physicians and APPs.
It is critical that all ED leaders, emergency physicians, and APPs provide consistent feedback to the major software vendors (Cerner, Epic, McKesson, Meditech, and so forth) to improve the performance of those systems. The software and other technologies must serve as tools that improve the services and work capabilities of our providers. They must use the industry definitions related to ED performance measures and produce dashboards that provide live feedback to improve intake, flow, and patient experience of care. Emergency physicians must step up to the important role in driving the information system developers to help move the industry ahead.
The EDBA data indicate there is correlation among intake processing of patients, overall flow, and walkaway rates. Despite ED volume and acuity increases that challenge ED providers, improved operations have been evident in many EDs.
Reference
- Wiler JL, Welch S, Pines J, et al. Emergency department performance measures update. Acad Emerg Med. 2015;22:542-553.
Pages: 1 2 3 | Multi-Page


One Response to “Emergency Department Flow, Patient Walkaway Key Performance Measures”
July 28, 2015
William WatkinsDid those EDs that place a provider in the intake system comment on how that provider is compensated for their work? If they are all salaried positions, it would not make a difference. Were there any groups placing a provider in the intake process that operated on a fee-for-service model? Did the improvement in efficiency cover the expense of placing a provider in a fee-for-service model in the intake process?