There is no disguising it. 2021 was perhaps the most challenging year ever for American emergency department (ED). The combination of staff losses and hospital system failures caused unprecedented operational problems and patient and ED staff dissatisfaction.
Explore This Issue
ACEP Now: Vol 42 – No 01 – January 2023The number of patients seen in American EDs has increased steadily since World War II. The early days of the pandemic from March 2020 to September 2020 saw a dramatic and uncharacteristic ED volume loss. While it takes a while for official government figures to be released, preliminary data found ED volume loss in 2020 that was approximately 14 percent compared to 2019. ED volumes increased from 2020 to 2021 and again from 2021 to 2022. Most EDs are now reporting volumes that are approximately the same as those in 2019, but acuity that is higher. The trend of EDs seeing older, sicker patients, combined with continued diversion of patients to retail clinics, telehealth, and other sources of care, has resulted in a net increase in patient severity/complexity for full-service EDs.
The Emergency Department Benchmarking Alliance (EDBA) has just released its 2021 Performance Measures Data Guide. Summary of the findings are as follows:
- The pandemic resulted in a significantly lower percentage of children presenting to EDs that are not designated as pediatric EDs.
- Multiple indicators confirm that patient acuity has increased.
- Patient arrival by EMS increased in 2020 and again in 2021. About 37 percent of those patients were admitted, a relatively constant percentage.
- The percentage of patients transferred out of the ED to another hospital in 2020 and 2021 was higher than historical numbers.
- The use of CT scans and EKGs increased across all groups of EDs.
- There was no significant increase in the time that ED staff needed to greet patients and have those patients seen by an emergency physician despite all other measures of performance getting slower.
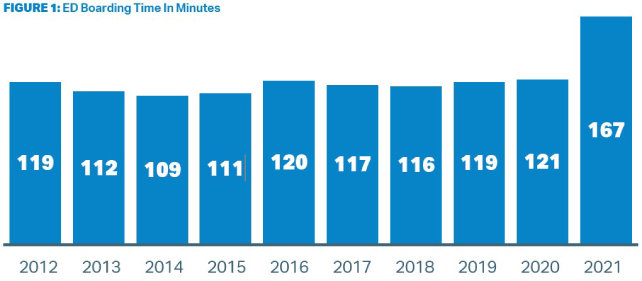
- Unprecedented high ED boarding times (about 39 percent greater than prior years) crushed most ED operations, negatively impacting all other areas of ED performance.
- The overall length of stay for all ED patients increased to 194 minutes in 2021, up from 186 minutes in 2018, 184 minutes in 2020, and 182 minutes in 2019.
- Patient walkaway rates (e.g., Left Before Treatment Complete) almost doubled compared to 2019, most likely a victim of increased boarding.
The ED Walkaway Rate Jumped Dramatically
Secondary to lengthy ED boarding times, the median patient processing times [measured as length of stay (LOS)] increased dramatically.
ED leaders must work with hospital leaders to shorten boarding time. In CMS’s language, boarding time is the median time (in minutes) from admit decision time to time of departure from the ED for patients admitted to inpatient status. Figure 1 shows that truly little progress had been made in reducing boarding time in the nine years ending in 2020. Then, in 2021, boarding times increased markedly by 39 percent (46 minutes).
Boarding time directly correlates with LBTC rates and ED length of stay. EDBA uses the “Left Before Treatment Complete (LBTC)” as the single statistic that counts all patients who present to the ED for care and leave before they are supposed to. This provides the most complete accounting for all patients who leave the ED, and includes those patients who leave before or after the medical screening exam, those that leave against medical advice (AMA), and those that elope.
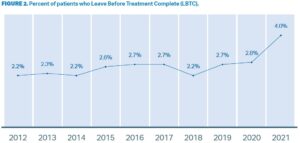
The percentage of patients who left the ED prior to the completion of treatment increased to 4.0 percent, from 2.8 percent in 2020 (Figure 2).
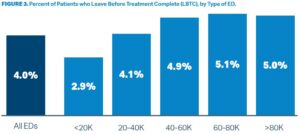
LBTC tracks closely and worsens with increasing ED volume (Figure 3). Every cohort had record-high LBTC rates in 2021, higher than in any year since the EDBA began collecting data in 2004. Even Freestanding EDs saw a jump in LBTC rates. In 2019, FSEDs had a LBTC rate of 1.6 percent. In 2021, that rate increased to 2.3 percent.
How dramatic was the increase in patients who walked away from the ED?
The overall LBTC rate of four percent in 2021 also represents far more patients than any prior year. In 2020, 3.8 million patients walked away from the ED before their evaluation was complete. In 2021, that amounted to about 6 million patients. 2.2 million more ED patients left before their ED treatment was complete than in 2020.
Working Forward: Restoring Flow Through the ED and Reducing LBTC Volumes
At the present time, ED and hospital leaders should anticipate that ED volumes have returned to the trend of stable increases.
Emergency department operations in 2021 were significantly impacted by many factors which reduced flow, increased walkaway rates, and greatly stressed ED staff. These operational challenges are now layered onto the 2022 volume of patients that are about the same, if not higher, than 2019. Increasing patient acuity also further strains ED operations.
The EDBA data indicate a correlation between processing of inpatients (boarding time), overall flow (length of stay), and walkaway rates (left before treatment complete).
ED boarding of inpatients, and other impediments to ED flow, negatively impact the quality of patient care, result in higher walkaway rates, patient and staff dissatisfaction, and a gap in available emergency services in the community. Boarding is a hospital-wide problem that will require significant hospital and ED leadership to restore and/or preserve ED flow, improve quality of care, and attract and retain high-quality ED staff.

Dr. Augustine is national director of prehospital strategy for US Acute Care Solutions based in Canton, Ohio; clinical professor of emergency medicine at Wright State University in Dayton, Ohio; and vice president of the Emergency Department Benchmarking Alliance.
Dr. Jouriles is professor and chair of emergency medicine at Northeast Ohio Medical University and vice chair of emergency medicine at Summa Health and US Acute Care Solutions.
Pages: 1 2 3 | Multi-Page


No Responses to “First Look: Emergency Department Operations in the Pandemic Year 2021”