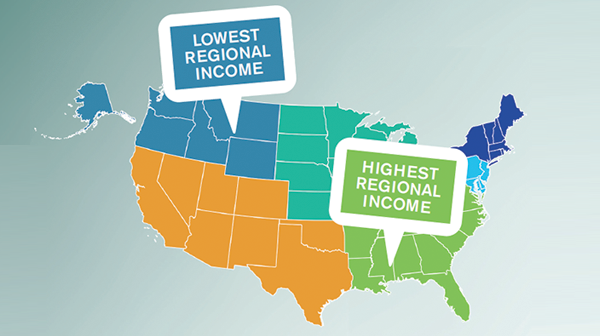
While emergency medicine remains the one specialty in the health care arena without standardization of income nationwide or, in many cases, statewide, there is now a benchmark to shoot for: $200 an hour. It crops up throughout the Midwest, Southeast, and Western regions regularly and can be found in parts of the Middle Atlantic and even the Northeast, but it remains elusive in the Pacific Northwest. This is a picture of that market from the perspective of dollars only, with data drawn from primary emergency medicine job Web sites, including EDPhysician.com, EDSource.com, EDOpenings.com, and ACEP’s Career Central, as well as from inquiries sent to all large national contract management groups. The annual income levels are based on an average of 1,632 clinical hours and include average RVU earnings and a benefits package valued at $25,000 where applicable. No sign-on bonuses, perks, or loan payback programs were included. Rankings are based on state averages, not the sporadic highs.
Explore This Issue
ACEP Now: Vol 33 – No 10 – October 2014The highest regional income is found in the nine states of the Southeast, primarily due to the elevated incomes in Mississippi and the high hourly rate of $200+ throughout the region.
Mississippi: Average: $240 hr./$400K annually, high of $337 hr./$550K annually
Tennessee: Average: $195 hr./$345K annually, high of $239 hr./$390K annually
South Carolina: Average: $190 hr./$335K annually, high of $240 hr./$400K annually
Georgia: Average: $190 hr./$335K annually, high of $250 hr./$430K annually
Arkansas: Average: $185 hr./$326K annually, high of $200 hr./$350K annually
North Carolina: Average: $185 hr./$326K annually, high of $220 hr./$400K annually
Florida: Average: $180 hr./$315K annually, high of $200 hr./$350K annually, sign-ons average $30K
Alabama: Average: $176 hr./$300K annually, high of $230 hr./$380K annually
Louisiana: Average: $170 hr./$300K annually, high of $200 hr./$350K annually
The Midwest region has the most states in the top 10 but a wider range of incomes throughout the 12. The new leader in the region is North Dakota, edging out the usual Wisconsin.
North Dakota: Average: $215 hr./$390K annually, high of $330 hr./$550K annually
Wisconsin: Average: $215 hr./$375K annually, high of $300 hr./$515K annually
Illinois: Average: $200 hr./$350K annually, high of $338 hr./$550K annually; Chicago: Average: $180 hr./$325K annually
Indiana: Average: $200 hr./$350K annually, high of $250 hr./$433K annually
Nebraska: Average: $200 hr./$350K annually, no significant highs
Kansas: Average: $190 hr./$335K annually, high of $210 hr./$345K annually;
Kansas City: Average: $200 hr.
Kentucky: Average: $185 hr./$326K annually, high of $298 hr./$500K annually; Nashville: Average: $200 hr.
Missouri: Average: $185 hr./$326K annually, high of $200 hr./$350K annually
Ohio: Average: $175 hr./$310K annually, high of $210 hr./$365K annually; Cleveland: Premier offering $250K in loan assistance for multi-year contract
Iowa: Average: $170 hr./$300K annually, high of $185 hr./$320K annually
Minnesota: Average: $170 hr./$300K annually, high of $200 hr./$350K annually
Michigan: Average: 160 hr./$290K annually, high of $200 hr./$350K annually
The nine states of the West represent the broadest range in averages, with highs in Texas and lows in Colorado.
Texas: Average: $220 hr./$380K annually, high of $300 hr./$500K annually; Dallas: High of $225 hr.
Oklahoma: Average: $206 hr./$345K annually, high of $220 hr./$360K annually; Oklahoma City: Average: $220 hr.
New Mexico: Average: $190 hr./$335K annually, high of $210 hr./$345K annually; Albuquerque: Potential: $200 hr.
California: Average: $180 hr./$315K annually, high of $220 hr./$360K annually; Los Angeles, San Francisco, and San Diego: Average: $170 hr.
Arizona: Average: $155 hr./$250K annually, high of $225 hr./$400K annually; Phoenix: Average: $250K annually
Nevada: Average: $155 hr./$250K annually, high of $227 hr./$370K annually; Las Vegas: Average: $260K annually
Colorado: Average: $140 hr./$230K annually; high of $184 hr./$300K annually
Pennsylvania climbs closer to Virginia in the Middle Atlantic region of six states plus the District of Columbia this year.
Virginia: Average: $195 hr./$345K annually, high of $250 hr./$435K annually
Pennsylvania: Average: $190 hr./$340K annually, high of $240K/$400K annually;
Pittsburgh: Average: $350K annually; Philadelphia: Average: $300K annually
New Jersey: Average: $180 hr./$310K annually, high of $200 hr./$350K annually
West Virginia: Average: $160 hr./$280K annually, no significant highs
District of Columbia: Average: $155 hr./$250K annually, high of $200 hr./$350K annually
Maryland: Average: $145 hr./$240K annually, high of $200 hr./$340K annually
Delaware: non-reporting
The upper-tier states drag down the Northeast income ranges this year.
Connecticut: Average: $170 hr./$300K annually, high of $200 hr./$350K annually
Massachusetts: Average: $170 hr./$300K annually, high of $230 hr./$400K annually; Boston: Average: $300K annually
New Hampshire: Average: $165 hr./$280K annually, high of $215 hr./$365K annually
Maine: Average: $160 hr./$250K annually, no significant highs
New York: Average: $160 hr./$260K annually, high of $170 hr./$300K annually;
New York City: Average: $150 hr.
Rhode Island: Average: $155 hr./$255K annually, no significant highs
Vermont: Average: $150 hr./$250K annually, no significant highs
As usual, bringing up the rear is the Pacific Northwest. Although actual numbers were hard to come by, the regional average is about $150 an hour.
Wyoming: Average: $185 hr./$326K annually, high of $200 hr./$370K annually
Oregon: Average: $160 hr./$290K annually, no significant highs
Washington: Average: $145 hr./$240K annually, no significant highs
Alaska, Idaho, and Montana: Average: $140 hr./$235K annually, no significant highs
These are guidelines from current opportunities and don’t necessarily reflect what is being earned with other employers across the country. When looking at compensation packages, get all the numbers and make sure to evaluate the whole by the sum of all the parts!
Barb Katz is president of The Katz Company EMC, a member of ACEP’s Workforce and Career Sections, and a frequent speaker and faculty at conferences and residency programs. She can be reached at katzco@cox.net.
Pages: 1 2 3 | Multi-Page


One Response to “How Much Do Emergency Physicians Make? A National Job Market Survey”
October 6, 2015
Richard WatsonGreat post..