The Centers for Disease Control and Prevention (CDC) released its statistical survey of emergency department visits for 2016 on April 1. Called the National Hospital Ambulatory Medical Care Survey (NHAMCS), it is a wealth of information for emergency physicians and will guide the data and trends for the emergency services for which they are responsible.1
Explore This Issue
ACEP Now: Vol 38 – No 10 – October 2019The Numbers
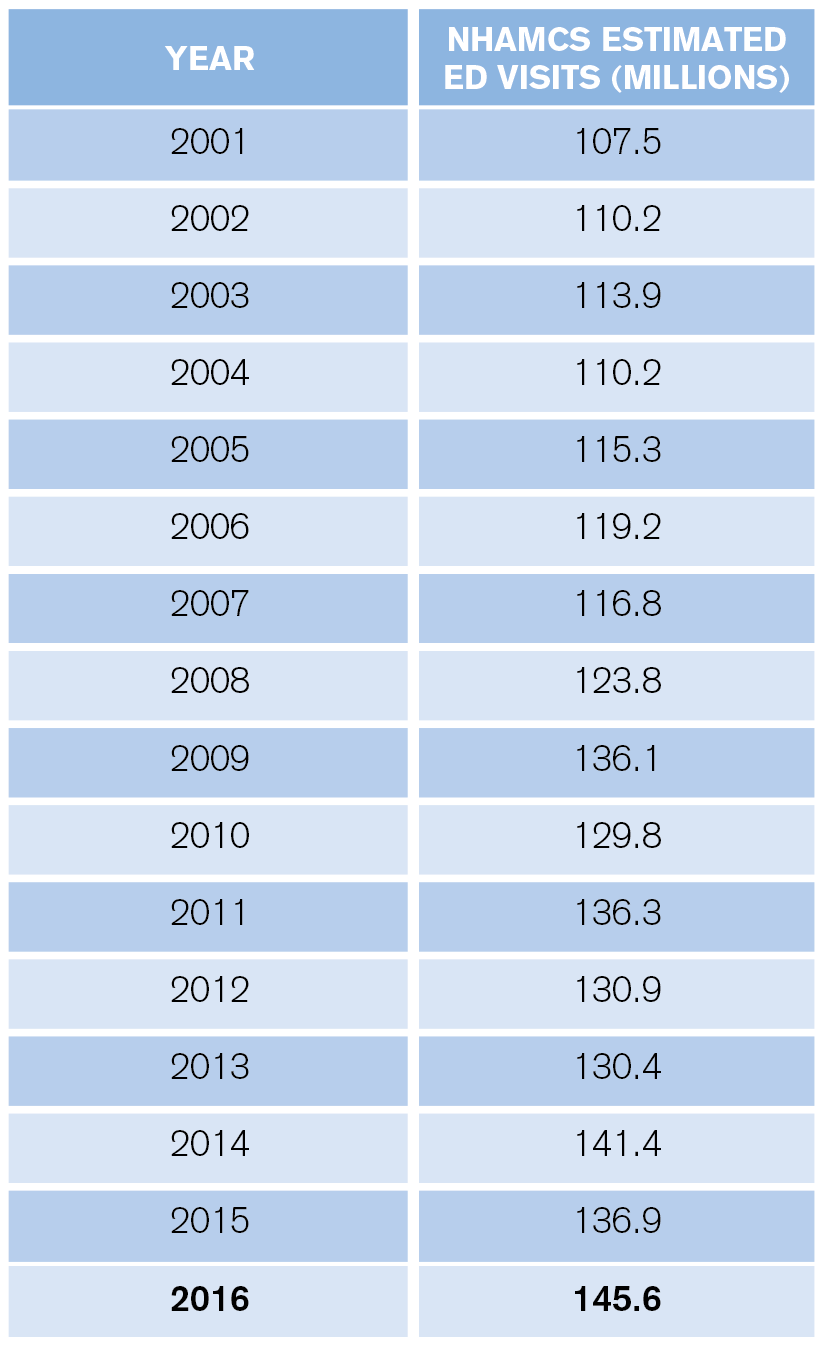
ED visit estimates increased from 136.9 million in 2015 to 145.6 million in 2016, a jump of 6.4 percent. The 10-year volume change is 24.7 percent, and for the past 20 years, the increase has totaled 61.2 percent (the 1996 ED visit estimate was 90.3 million). The past 15 years of volume estimates appear in Table 1.
These data may not match the experience in every emergency department and every community. First, the CDC typically estimates the lowest volume of ED visits, and the NHAMCS does not include visits to freestanding emergency departments. Second, there are changing patterns of ED use based on community sources of unscheduled care. Third, the patchwork of primary care systems in the country influences the number of ED visits locally.
What is apparent from the CDC data is that the trend of emergency departments seeing older, sicker patients, combined with continued growth in retail clinics, telehealth, and other sources of care for nonemergent problems, will yield a net increase in the average severity and complexity of patients seen in full-service emergency departments.
Who Are the Patients?
ED visits increased from 369 to 458 visits per 1,000 people between 1995 and 2016. High utilizers continue to include infants, nursing home residents, the homeless, black persons, and people over age 75.
Infants under age 1 had 987 visits per 1,000 persons. This is relatively high utilization and represents an opportunity for parent education.
There were roughly 2.2 million visits for patients who reside in nursing homes, for a utilization of 1,594 visits per 1,000 residents. Approximately 33 percent of nursing home patient ED visits resulted in hospital admission (739,000), with an average length of hospital stay of 5.7 days.
Persons classified as homeless represented a larger visit load for EDs compared with prior years. In 2016, homeless persons accounted for an estimated 1,446,000 visits, a rate of 2,630 visits per 1,000 estimated number of homeless persons. Those visits equal roughly 1 percent of total ED visits.
The CDC also categorized visit rates for white, black, Hispanic, and other races/ethnicities. The visit rate was 435 visits per 1,000 white people, 404 visits per 1,000 Hispanics, and 804 visits per 1,000 black people. The visit rate was 172 visits per 1,000 persons of other races (ie, Asian, native Hawaiian or other Pacific Islander, American Indian or Alaska native, and persons with more than one race).
The ED population is aging in line with national demographics. Persons over age 65 accounted for 15.8 percent of ED visits, and persons age 75 and older had 605 visits per 1,000 in 2016. Thus, emergency departments must prepare for larger numbers of patients and develop processes tailored to older persons. In addition, older patients require more workup, treatment, and, thus, more time in the department.
Finally, because older patients are admitted to the hospital more often, they spend more time as ED boarders. Planning for new or renovating old emergency departments should account for these shifting demographics.
Why Do They Come?
The acuity of visits to the emergency department continues to increase, with a mere 4.3 percent of ED visits classified as non-urgent (the highest rates of these visits were for patients under age 15).
The reasons for visits were coded using a classification system developed by the CDC’s National Center for Health Statistics. The NHAMCS includes a set of tables that relate to that classification, and estimates are presented by age and sex. Injuries accounted for an estimated 42.2 million visits, or 29 percent of ED visits. By comparison, in 2009 there were an estimated 45 million encounters for injuries. This trend reflects the success of many injury prevention programs, leading to an ED population distribution that features less injury and more illness.
The leading causes of injury, poisoning, and adverse effect–related ED visits were falls (10.5 million visits, or 23 percent of total injury visits) and motor vehicle traffic crashes (3.7 million visits, or 8.1 percent of total injury visits).
When viewed through the lens of “presenting complaint,” stomach and abdominal pain were the most common in 2016, accounting for around 9 percent of visits. Chest pain was next highest at 5 percent.
There were 5.5 million visits with a primary diagnosis of mental disorder noted in the emergency departments, of which 2.4 million visits included evaluation by a mental health provider.
Quality Performance Measures
Roughly 3.2 million visits resulted in the patient leaving before treatment was complete, or about 2.2 percent of all ED visits.
There are hospital quality indicators related to ED revisits and hospital readmissions that ED leaders must be aware of. About 2.7 percent of visits were made by patients who had been seen in the same emergency department in the preceding 72 hours (down from an estimate of 5.7 percent in 2015), and the CDC estimates 4.9 percent of ED visits were for follow-up.
The CDC report in 2011 indicated 6.3 percent of patients admitted through emergency departments had been discharged from a hospital in the preceding seven days. In 2016, roughly 2.9 percent of ED visits that led to hospital admission were patients who had been in an emergency department within the prior 72 hours. That number is down from 4.7 percent in 2011.
There is an ongoing increase in the use of diagnostic tools in the emergency departments, especially ECGs. The use of CT scanning appears to have plateaued, but the use MRI and other special imaging procedures (such as ultrasound) is increasing.
Planning for the Future of Emergency Care
Sources other than the CDC study document the growth of alternative care sites compared with full-service, hospital-based emergency departments. For example, a MedPAC report in June 2017 found an increasing number of freestanding emergency departments.2 In 2016, there were 363 off-campus emergency departments in 35 states affiliated with 300 hospitals. MedPAC counted 203 independent freestanding emergency centers, mostly in Texas.
So far, there are no estimates of the total volume seen in freestanding emergency departments. However, the Emergency Department Benchmarking Alliance (EDBA) database in 2017 listed 237 hospital-owned freestanding emergency departments that saw approximately 3.6 million patients, for an average of 15,000 visits per site. This means hospital-owned and independent freestanding emergency departments may combine for around 8.5 million visits per year.3
There are also a growing number of urgent care centers. As of 2018, the Urgent Care Association counts 8,285 urgent care centers, amounting to 89 million visits and an $18 billion industry.
The demand for emergency departments continues to rise, and there is continued growth in the percentage of overall hospital admissions presenting through the ED. The EDBA data survey found that roughly 69 percent of hospital inpatients are processed through the emergency department. This clearly demonstrates the emergency department has become the front door to the hospital.
The CDC findings should be discussed with hospital and community leaders so that adjustments needed to improve patient safety and service are made, and that the value of emergency services is clear.
References
- Rui P, Kang K, Ashman JJ. National Hospital Ambulatory Medical Care Survey: 2016 emergency department summary tables. CDC website. Accessed Sept. 20, 2019.
- Medicare Payment Advisory Commission June 2017 Report to the Congress: Medicare and the Health Care Delivery System. MEDpac website. Accessed Sept. 20, 2019.
- Alkon C. What’s behind the growth of urgent care clinics. Med Econ. 2018;95(17).
Pages: 1 2 3 | Multi-Page


No Responses to “The Latest Emergency Department Utilization Numbers Are In”